Drove eleven hours today. Pretty good trip. How’s everybody doing?
Desktop and pumpkin pie
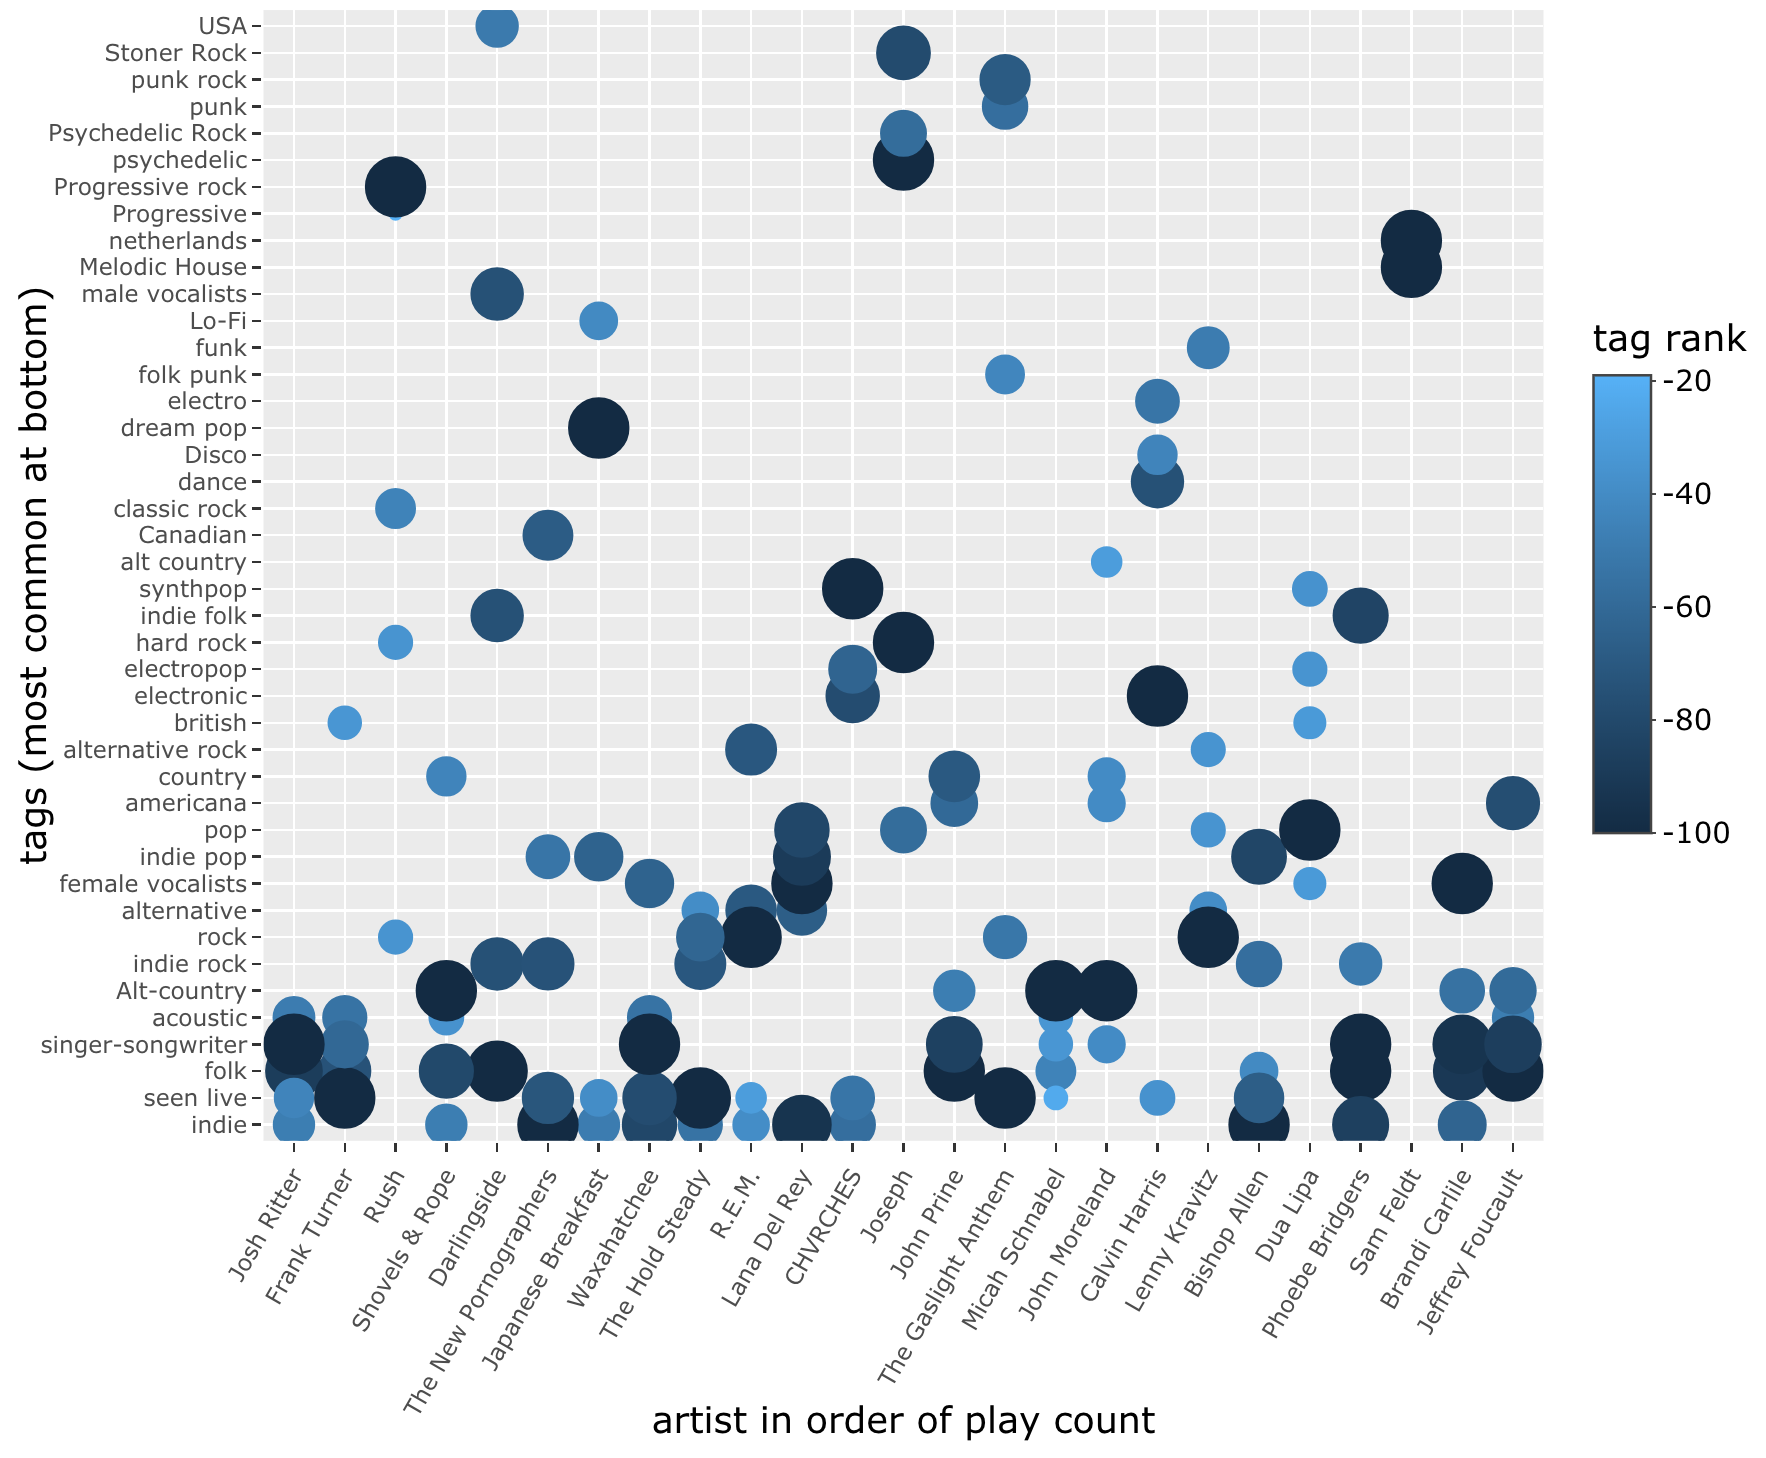
Okay, one final (probably) revision of tuneR for today, adding a bit of color and sizing to the plot of tags by artist, to show variation in tag rank within each artist.
What I’d give for a fish shell-style approach to command history in the R console.
A lot. I’d give a lot.
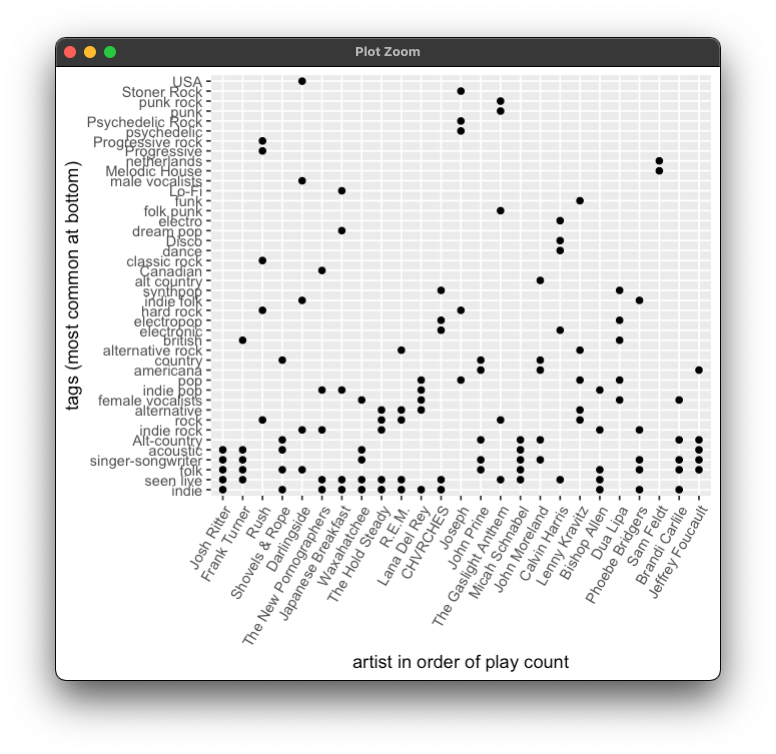
Today’s small revision of tuneR adds a scrollable table of user-assigned tags to your artists, and a plot of artists by tag sorted to show the most used tags across your top 25 artists this year. Coming soon – possibly some track-level data!
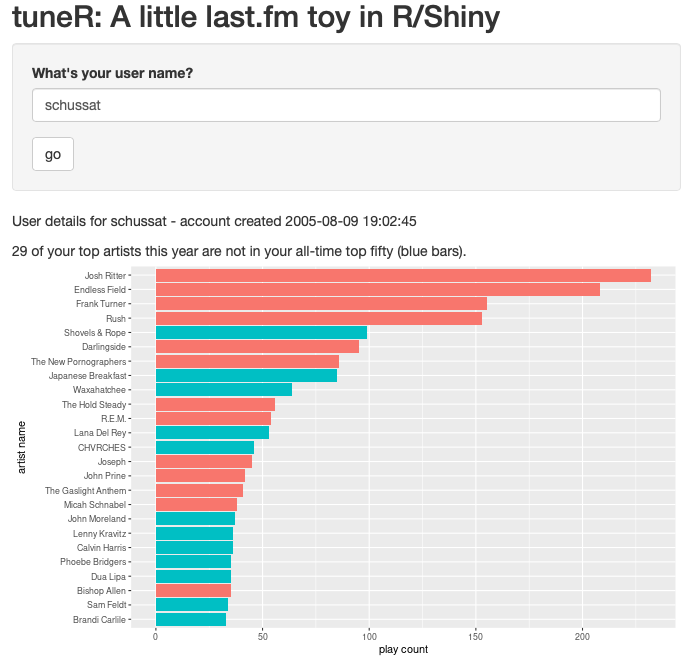
Inspired by all the enthusiasm for Spotify’s end-of-year Wrapped summaries, tuneR is my extremely rudimentary first start at my own version, done in R/Shiny. I’d love to hear if it works for you and what else would make it more fun!